Enhancing Agricultural Productivity and Monitoring Crop Health Using Remote Sensing: Insights from Sentinel-2 Satellite Data
- Agriculture
Gabriela Quintana Sánchez
- 0
- 11 minutes read
BIOPHYSICAL VARIABLES FROM REMOTE SENSING
Satellite technology and data for the past decade have been optimized for agricultural applications, which can be applied anywhere in the world. More and more vegetation bio-geophysical variables extraction by the processing of satellite data are disrupting the ground-level measurements due to their spatial and temporal availability. Specifically, optical Earth observation (EO) satellites enable the retrieval and monitoring of plant bio-geophysical variables, allowing to build of very accurate growth and health patterns or knowledge for almost all the most common cultivated crops. As such, variables like the ones mentioned below provide very useful information directly to the agriculture or agricultural land managers, which allows them to make an informed decision (e.g. when to irrigate, when to defer pests, or preemptive measures based on previous knowledge) to boost the productivity or comply with existing environmental regulations (e.g., EU’s CAP).
Leaf Area Index (LAI), this variable, quantifies the amount of leaf area in an ecosystem and is a critical variable in processes such as photosynthesis, respiration, and precipitation interception. It determines the size of the interface for the exchange of energy (including radiation) and mass between the canopy and the atmosphere. The measured LAI is typically distributed between the 1-7 values, while low LAI values (<1) are not frequently measured.
The fraction of Photosynthetically Active Radiation Absorbed by the canopy (FAPAR), refers only to the green parts (considered as leaf chlorophyll content higher than 15µg.cm-2) of the canopy.
Canopy water content (CWC), defined as the mass of water per unit ground area (g.m-2), the water represents between 60 % and 80% of the living plant mass. The relative water content could be approximated to a value close to 75 % for the green leaves.
Chlorophyll content in the leaf (Cab), the chlorophyll content is a very good indicator of stresses, including nitrogen deficiencies, measured in (µg.cm-2) corresponds to the content of chlorophyll a, chlorophyll b and carotenoids, varies between 0 to 90 µg.cm-2.
Fraction of Vegetation Cover (FCOVER), adimensional values used for the monitoring of green vegetation.
SAR Satellites for Agriculture
SENTINEL 2 images
The multi-spectral bands and interval sampling of the SENTINEL-2 have great potential for studying canopy or, in general, vegetation structure due to its optical properties and bandwidths. It can go beyond the use of vegetation indexes (NDVI) which makes use of the red and near-infrared bands by involving more specific or custom indexes based on spectral analysis and correlated with ground spectral measurement libraries.
The following table shows what are the 12 spectral bands in which the SENTINEL-2 satellites are capable of recording information.

MONITORING OF GROWN WITH REMOTE SENSING
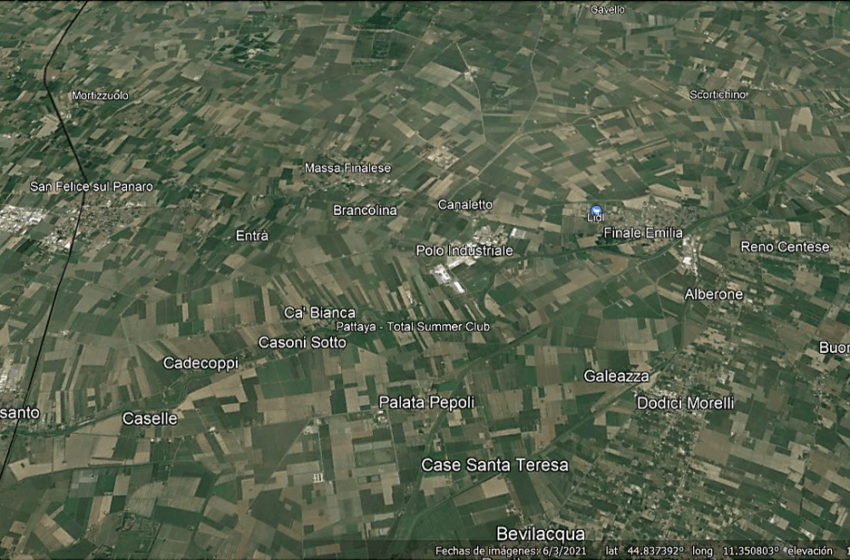
We chose for the current article subject the SENITNEL-2 data processing recorded on February 07, 2023, in order to obtain the geophysical parameters for crops located in Northern Italy, in an area which includes the towns of Mirandola, San Felice sul Panaro, Camposanto, Massa Finalese, Canaletto, Finale Emilia, Dodici Morelli, Renazzo, Cento, Casumaro, and Sant’ Agostino. Predominantly in this area of Italy there are cultivated primarily corn, rice, sugar beets, and soybeans, but also meat, fruits and dairy products are abundant. The results obtained after processing these data are compiled and shown overlapping in the Google Earth Engine (GEE) platform.

Crops in Northern Italy. In the figure from above, it can be easily seen in green and within the grey polygons (i.e., parcels) with the Leaf Area Index measured (with adimensional values between 0.01 – 1.43). This is a very important indicator for radiation and precipitation absorption or interception, energy conversion, and water balance, and it is considered one of the most reliable parameters for plant growth and health in agricultural applications. Besides its uses in measuring crop growth and as an indicator of yield, LAI is finding new applications in precision agriculture. LAI can be useful in calculating the correct amounts of foliar sprays of pesticides or fungicides that are needed to protect a crop. LAI can also diagnose the nitrogen status of cereals through satellite imagery leading to timely applications of fertilizers to boost yield.

Crops in Northern Italy. In this figure, we can see in green polygons parcels referred to crops with nitrogen deficiencies (including hormonal upregulation of root growth and closing of aqua pores which results in shoot water stress and stunted shoot growth). This variable, LAI_Cab, is well suited for quantifying canopy-level nitrogen content. It is used for nitrogen stress evaluation, the chlorophyll content is a very good indicator of stresses including nitrogen deficiencies; the values vary between 0 to 90 g.cm2. In this case, the values vary between 30.58 and 61.15 g.cm2

In this figure, we can see the combination of the variables LAI and CW (with values varying between 0.016 – parcels in dark yellow- and 0.033 g/m2 – parcels in light blue -), where CW is referred to as Water Content in the leaf, required for monitoring drought conditions, assessing forest fire susceptibility, or improving soil moisture retrievals, among many other applications. The estimation of CWC from optical remote sensing generally relies on the water absorption features centred at 970 nm, 1,200 nm, 1,450 nm and 1,950 nm. Vegetation water content is one of the important biophysical features of vegetation health, and its remote estimation can be utilized to real-timely monitor vegetation water stress.

The following variable calculated (with adimensional values between 0.26 and 0.53, having in green the maximum values measured. In this figure, we can identify the parcels with maximum values measured), in the same crops zone, are used to separate vegetation and soil in energy balance processes, including temperature and evapotranspiration. It is calculated from the leaf area index and other canopy structural variables; it is a very good candidate for the replacement of classical vegetation indices for the monitoring of green vegetation.

The last parameter calculated refers to the proportion of incoming solar radiation absorbed by vegetation in the spectral range of 400–700 nm and represents the maximum photosynthesis capacity of vegetation, with adimensional values between 0.36 and 0.69, having in green the maximum values measured. In this figure, we can identify the parcels with high levels of radiation absorbed.
SENTINEL 2 images can be used to identify nutrient deficiencies, diseases, water deficiency, weed infestations, insect damage, hail damage, wind damage, herbicide damage, and plant populations.
The information generated from remote sensing can be used as support in the knowledge of the variable characteristics of the health of the plants, also rate applications of fertilizers and pesticides, allowing the farmers to treat only affected areas of a field.
The most striking conclusion, specifically for these applications, is that problems which may have a direct influence on the growth and health of the crops can be identified and monitored before they can be visible with the naked eye or by simple visual inspections on-site.
At Groundstation.space, we will continue with other articles focusing on the current topic, constantly searching for new applications, or switching the centre of analysis from passive sensors (optical) to active ones (radar).
Article editor: Andrei Bocin-Dimitriu