Empowering Agriculture with Satellite Data. Example of Moldova
- Agriculture
Gabriela Quintana Sánchez
- 0
- 17 minutes read

Apart from scarecrows, biophysical variables for vegetation derived from satellite data can monitor fields, crops and fruit trees — a story from Hîncești District, Republic of Moldova.
Satellite imagery and products speak a thousand words. Actionable information and modern Earth observation data are becoming practical instruments for agronomists, farmers, growers, and regulators throughout the year and during the crops’ different stages of growth. They have the potential to transform traditional agriculture (not disrupting it, though) with their applicability to every agricultural activity or farming operation. Since ancient times we used scarecrows to protect our crops and farms, which remains an efficient (human creativity) guardianship method. Still, with the help of modern maps, we can detect and even predict crop health issues, apply localised treatments, monitor crop development, learn where water is needed, or fertilise and nourish the plants to increase their productivity and yield.
In the previous article, we introduced you to some of the biophysical variables derived from satellite data, hereby, we will try to demonstrate how to interpret these variables and obtain results that everybody can understand and use. To demonstrate this in a real environment, we focused our analysis on an area from Hîncești District, the Republic of Moldova.
Satellite Data for Agriculture
The primary economic activity in Hîncești District is agriculture and the food industry. The main products from this area include wine, alcohol, bakery products, fruit, and sausages. From a total of 93,361 ha (hectare) of agricultural land, arable land represents 62.3%, vineyards 17.5%, and orchards 6.0%. Other products include shoes, clothes, furniture, and concrete building blocks.
As mentioned, satellite imagery allows the farmer or any other user to gain valuable insights. By analysing these images, they can observe the actual size of their fields in a single snapshot, accurately determine the geographical location, and identify cultivated parcels. Additionally, they can qualitatively and quantitatively classify their crops and track their progress on a weekly basis (Sentinel satellites revisit locations every six to 12 days worldwide). This information enables them to proactively plan the most effective crop management or rotation strategy based on soil quality and nutrient levels. They can also divide their land assets into specific perimeters or zones of interest, crucial steps in planning and maximising yields.
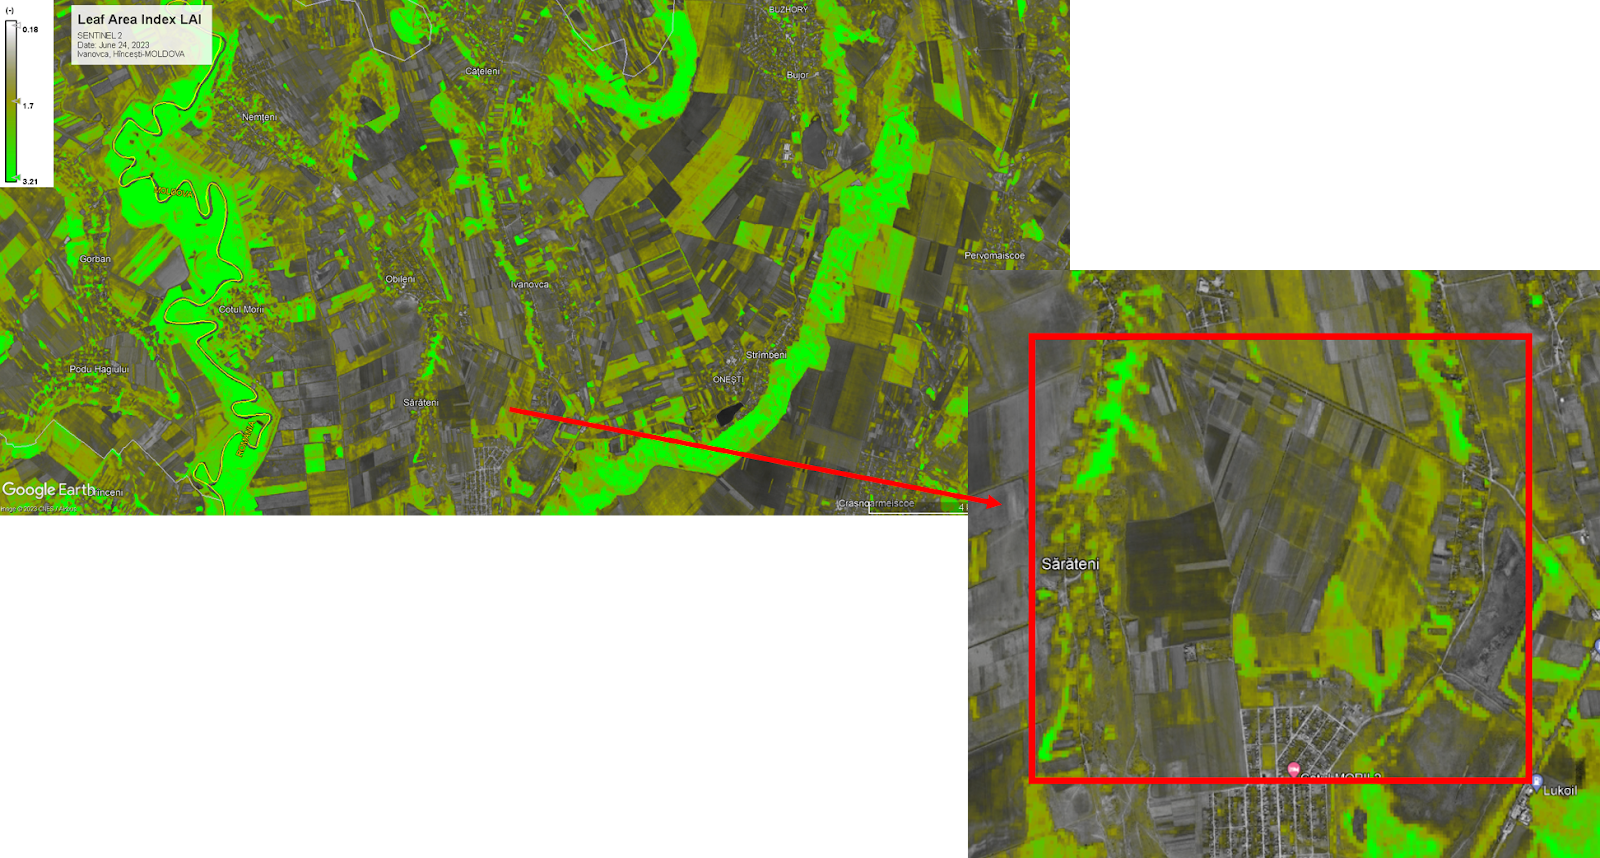
LAI Index-Hîncești District, Moldova (data overlapping in Google Earth)
Satellite data processing for agriculture can produce images capable of generating thematic maps. Each thematic map contains biophysical variables or markers that can help a farmer visualise (sometimes where even the human eye can’t see) if the crop is damaged or is losing its vitality. Subtle changes otherwise difficult to be observed at the ground level can be detected and mapped; for example, the LAI (leaf area index) indicates which parcels (in bright green) thrive and are, in general, experiencing better growth and health-the amount of leaf area is a critical variable in processes such as photosynthesis, respiration, and precipitation interception- (please look at Enhancing Agricultural Productivity and Monitoring Crop Health Using Remote Sensing: Insights from Sentinel-2 Satellite Data – Groundstation). While other parcels (in pale green) can indicate a possible problem with the crops which may require intervention, such as foliar sprays of pesticides or fungicides to protect them from pests and fungi; based on the satellite images, important decisions about how much and where it is necessary to intervene can be made, and thus calculate with better accuracy the costs or possible loss.
In the image below, we can see how we can zoom in on the map to the level of individual parcels, where we can quickly identify the extent of the fallow land (in black), which parcels are cultivated (in green) and which ones (in pale green) may require fertiliser, nourishment or water; for soil water content many indexes correlate with LAI that can provide a clear image where irrigation is necessary or where there is too much surface, or identifying the presence of shallow surface water which can lead to the alteration of the crop (in this case the pale green areas).
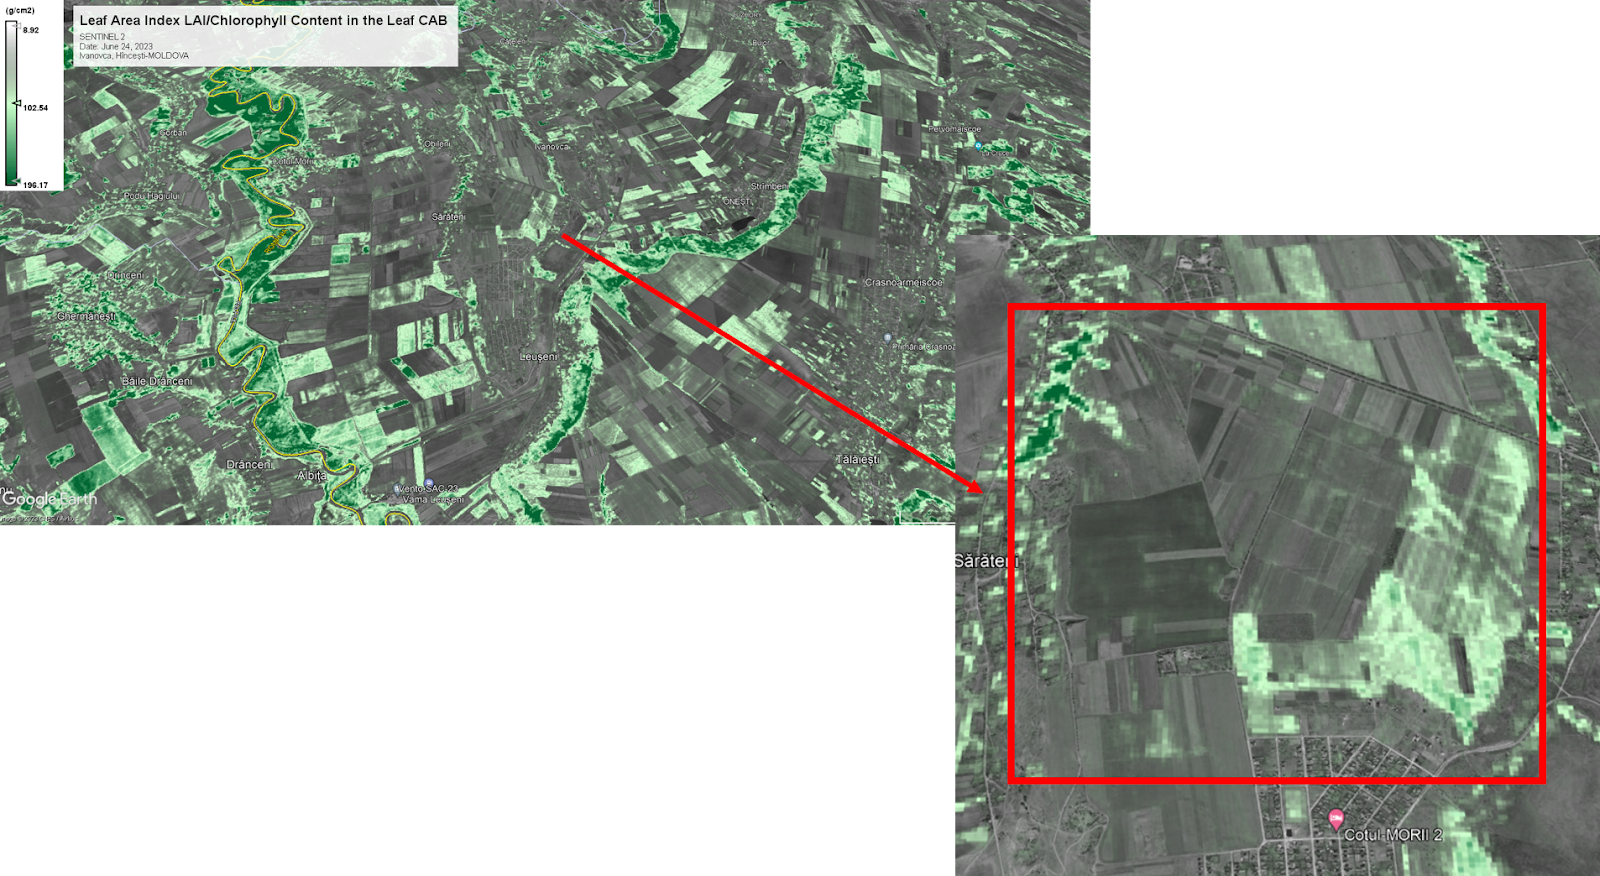
Using the same parcel example, with the LAI CAB index (please look at Enhancing Agricultural Productivity and Monitoring Crop Health Using Remote Sensing: Insights from Sentinel-2 Satellite Data – Groundstation), a farmer would know which parcels can grow faster and which parcels require nutrients to support their growth-the chlorophyll content is a very good indicator of stresses, including nitrogen deficiencies-. This specific index shows the farmer which parcels (in dark green) have high nitrogen content (nitrogen is an important component of chlorophyll and is generally present in high concentration in vegetation that is growing quickly). However, by this moment, we should have mentioned that colour intensity should not be used as absolute values but rather relative, dependent on various already known calibration or spectral indicators, and the result of each crop’s characteristic chlorophyll content; even more, the production of digital maps may vary in depicting biophysical variables values per pixel, as different shades or scales of colour might be used while they are used. That is why sometimes it is very useful to display side-by-side individual values of these pixels in graphs which show the numerical absolute values of the indexes. Resuming our interpretation, knowing which parcels have a high or low nitrogen content based on the indexes values can help the farmer to act preemptively and solve growth issues before it is too late, in this way preventing unwanted crop loss.
Indicators of Good Plant Health
The use of biophysical variable maps allows agricultural domain users in general (not only farmers) to gain insights and knowledge, leading to a better understanding of crops’ phenology or yield; for example, plants with nitrogen deficiency are thin, pale, subject to chlorosis, and will have a poor yield. The pale green colour and yellowing, in general, are considered symptoms of an existing condition besides nutrient deficiency. By knowing when and where to control nitrogen deficiency in plants and intervene with organic and chemical methods, farmers can save their crops and increase yield.
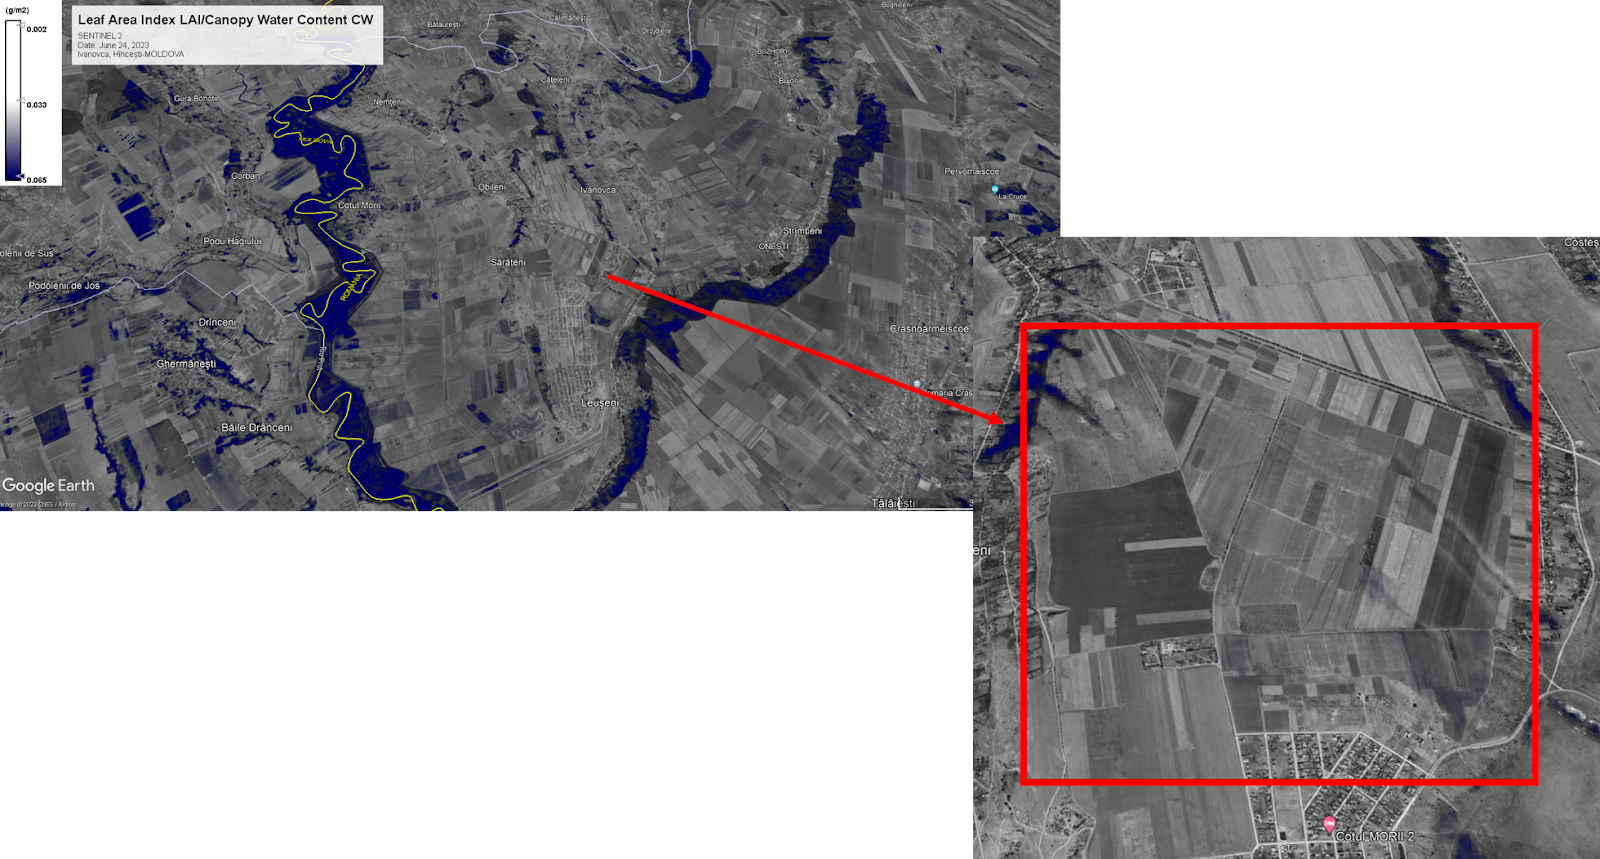
Other indicators such as LAI/CW (please look at Enhancing Agricultural Productivity and Monitoring Crop Health Using Remote Sensing: Insights from Sentinel-2 Satellite Data – Groundstation) show the content of water for plants within each of the parcels (maximum water content in dark blue)-define the mass of water per unit ground area-; thus, this index is widely utilised to monitor and assess crop drought. In this way, a farmer can plan in time and schedule when he needs to irrigate his crops. Irrigation, similar to fertilisation, requires knowing in advance where it is necessary to spray or flush water and which exact treatment decisions need to be made depending on the specific growth stage of the crop or plant. The irrigation will not only lead to a richer fruit harvest but can also influence the quality and shapes of the fruits.
The United Nations project in Moldova, “Promotion of climate change and disaster risk reduction solution in the water and civil protection sectors for enhanced rural resilience”, published in an article entitled “Innovation tastes like cherries in Hincesti” the following statement: “…several years ago, this place was covered with fallow land and vineyards, forgotten by all. The Grosu brothers (farmers in Hincesti District) decided to set up a modern cherry orchard and bought 15 ha of land, being attracted by the beauty of the scenery and the advantageous location of the agricultural fields, with good water discharge in case of heavy rains. They knew from their own experience that access to water is the most important thing for a farmer, especially in the conditions of the Republic of Moldova, which is severely affected by drought.”
How, where, and when to use water is of the most importance in this case as well and using satellite imagery can help provide actionable information using biophysical variables maps like the ones we presented and interpreted above.
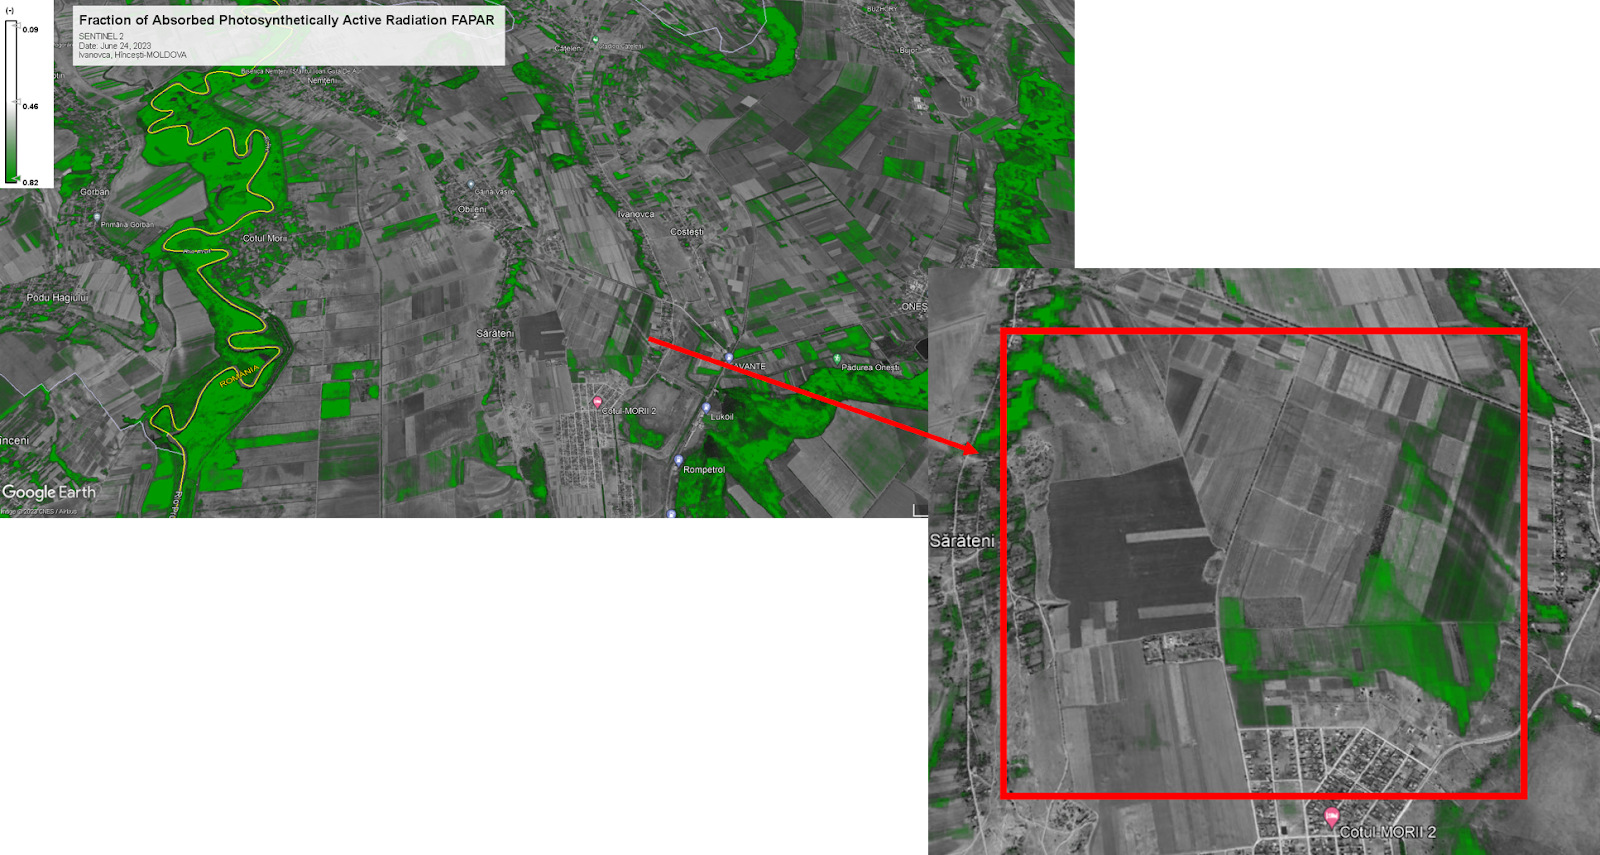
Another variable that farmers can use to gain knowledge about the health of their crops or farms (here depicted in green) is the FAPAR index (please look at Enhancing Agricultural Productivity and Monitoring Crop Health Using Remote Sensing: Insights from Sentinel-2 Satellite Data – Groundstation). This index is specifically susceptible to the green and live elements of vegetation or canopy and can be used as an indicator for the evolution of the vegetation cover too-refers only to the green parts of the canopy-. In our example, some parcels shown in the image have little capacity for absorption, which indicates to the farmer that the crops require fertiliser or nourishment.
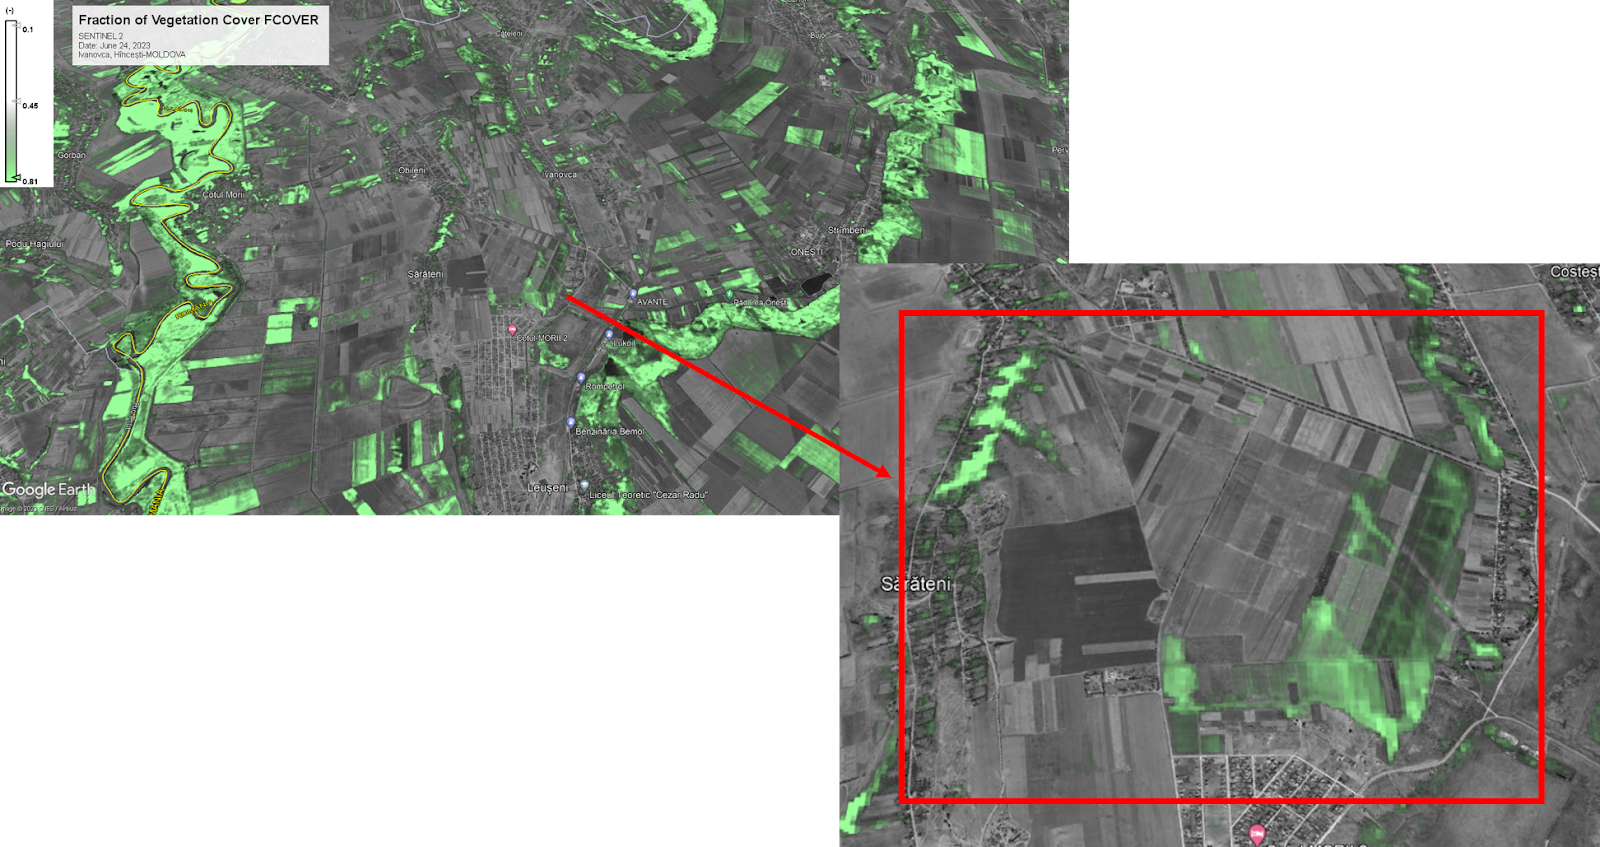
Similarly, the FCOVER index (please look at Enhancing Agricultural Productivity and Monitoring Crop Health Using Remote Sensing: Insights from Sentinel-2 Satellite Data – Groundstation) allows farmers to quantify the spatial extent of vegetation, in this case, its crops-monitoring of green vegetation-. It is also associated with healthy and vigorous vegetation (in bright green), and when the index is mapped constantly, it permits the identification and addressing of vegetation problems early, before large-scale damage occurs. In this way, it is known when and where exactly to act, as it can help to quickly identify affected vegetation.
We tried to demonstrate, one by one, how satellite data allows us to observe and record different biophysical variables as well as the use of different (vegetation) indexes to map parcels health or needs. Moreover, the integration or overlay of these indexes allows us to compare and complement the information. Thus, farmers (or any interested user) can gain more insight and knowledge from it. With the ability to monitor and manage each corner of their agricultural land (parcels), the farmers can protect and enhance their crops. Also, it is possible to identify which parcels are fallow, which crops need water or additional nourishment which can not be taken otherwise directly from the soil, and which crops suffer from pests or have other deficiencies by simply using satellite imagery (i.e., “a thousand words”) and actionable information. Nonetheless, the examples provided above are only a snapshot in time as the satellite data used for the processing of imagery were all recorded in a single sweep (single pass of the satellite over the specific area) during a specific date. The more data we collect and interpret, the better the image that is obtained. Mathematical algorithms are used to fill data gaps or increase resolution whenever there are multiple recording dates. Also, the methodology for mapping and analysing time series based on these individual images can provide even more useful information. As such, vegetation indexes calculated from historical imagery can be used to create baselines for in-field variation of crop phenology and productivity.

During the growing season, the farmers need to make critical decisions in real time. As an unanticipated weather variation, for example, a wet or dry spring can affect crop development and alter the periods during which pest infestations or disease outbreaks occur.
Copernicus Land Monitoring Service
Nowadays, we can access the Copernicus Land Monitoring Service (see in Copernicus Land Monitoring Service) to use satellite images and in-situ data in order to create reliable products and services.
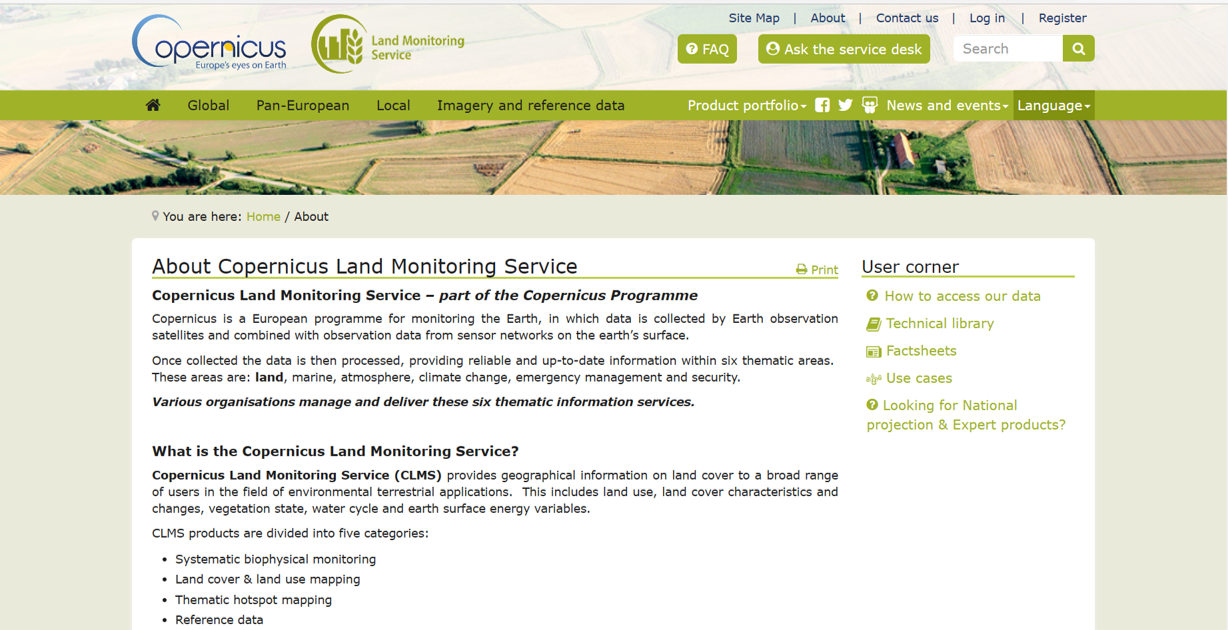
Satellite imagery forms the input for the creation of many information products and services, such as land cover maps or high-resolution layers of land cover characteristics. Any citizen or organisation around the world can access the Copernicus Land Monitoring Service on a free, full and open-access basis. This is in line with the Copernicus Programme’s overall data and information policy which promotes the use and sharing of Copernicus information and data.
Read more
This article is part of our series on SAR Remote Sensing Applications.
Featured image credit: Hîncești district, Moldova, in 1980
Article edited by Andrei Bocin-Dumitriu and Jerry Yao


