Space Data for Wildfire Mapping
- Disaster Management
Gabriela Quintana Sánchez
- 0
- 11 minutes read

Wildfires are uncontrolled fires that burn in wildland vegetation, often in rural areas. Countries worldwide face the hazard of wildfires, especially during drought season. It can start with a natural occurrence — such as a lightning strike — or a human-made spark. However, it is often the weather conditions that determine how much a wildfire grows.
The threats and consequences of wildfires
Over the past years, there has been a lot of media coverage on major wildfires. For instance, Portugal experienced the largest number of wildfires in Europe since 1993, destroying over 10% of the country’s forests. In 2003, these fires claimed 18 lives. Similarly, Portugal witnessed the highest number of forest fires in Europe during the summer of 2016. A staggering 13,261 fires occurred, resulting in a massive area of 399,131 acres burning down.
Russia also lost more than 5,978,107 acres of protected territory in 2016, which included about 4,798337 acres of forested land. The first fire started in Irkutskaya Oblast, and by the end of the year, 10,089 wildfires had devastated the country.
Spain, another example, had more than 400,000 wildfires in the last three decades. The country experienced 8,817 fires in 2016, with 22 big forest fires, which represent about 49% of the entire area burned (162,637 acres). (read more about it here).
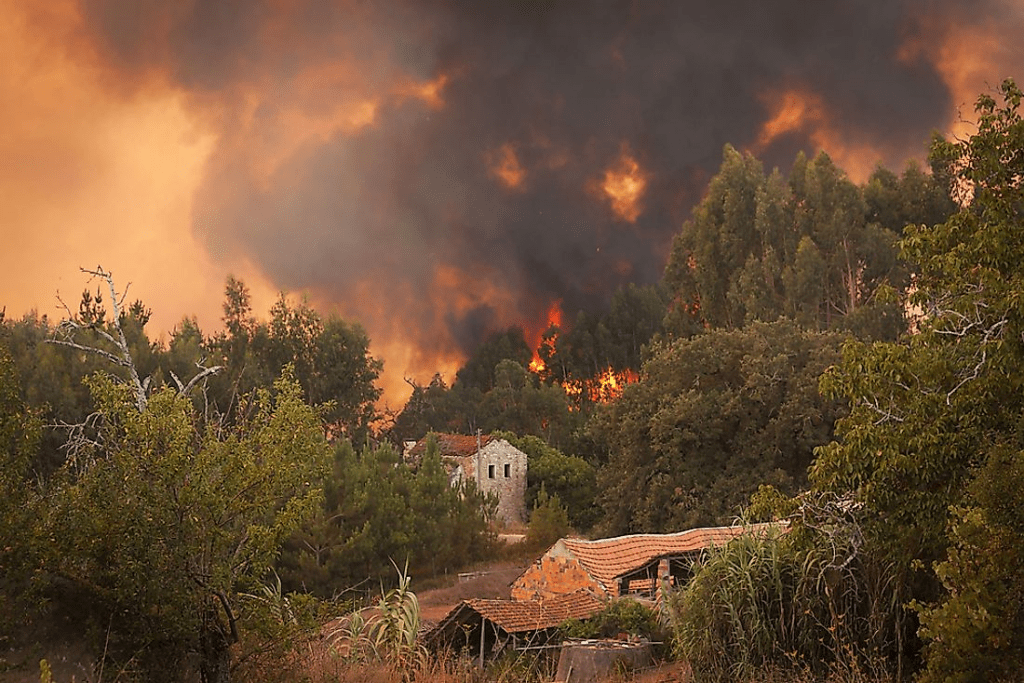
Forest fire in Portugal (source: WorldAtlas)
In 2021, California suffered wildfires, with 8,835 fires recorded, resulting in 2,568,948 acres (1,039,616 ha) burned. Approximately 3,629 structures were damaged or destroyed by the wildfires, and at least seven firefighters and two civilians were injured.
The long-term trend is that wildfires in the state are increasing due to climate change. The 2021 wildfire season was exceptionally severe in California. Still, it fell short of matching the magnitude of the previous year’s wildfire season, which happened to be the most extensive season ever documented in the state.
Forest fires have the ability to heat up the entire planet; a NASA study from 2016 revealed that in ecosystems such as boreal forests, which store more carbon than any other terrestrial ecosystem on Earth, the effects of climate change are playing out twice as fast.
Worldwide, wildfire smoke kills an estimated 339,000 people a year. Tenfold increases in asthma attacks, emergency room visits, and hospital admissions have also been reported when smoke envelops the places where people live.
Wildfires and Space Data
Society has to learn to live around wildfires: we cannot predict where, when, or how a wildfire starts, so it is necessary to generate burn area maps when it happens to be able to make decisions during succeeding drought seasons. For that reason, satellite images like SENTINEL 2 are necessary tools for being better equipped for such events that will only ever happen more frequently due to climate change.
How Satellites are Managing Wildfires
At Groundstation.space, we focus on making space data & technology manageable and comprehensive for end-users and maximising the value of unique Earth Observation data. We applied two methods used in burn area mapping: a combination of RGB (false color infrared) and the index Normalized Burn Ratio-NBR to determine the burn area (burn severity can be described as the degree to which an area has been altered or disrupted by the fire).
To calculate the affected area in a fire that occurred in California in 2021, we used two SENTINEL 2 images, with dates between July 5 and August 29, 2021, to make a combination in RGB (Red-Green-Blue) of the bands 12-11-8A (SWIR and Narrow NIR)- taking advantage of the spectral resolution of SENTINEL 2 (defined as a measure of the ability of the instrument to distinguish features in the electromagnetic spectrum). The 13 spectral bands of SENTINEL 2 range from the Visible (VNIR) and Near Infra-Red (NIR) to the Short Wave Infra-Red (SWIR): 4 x 10 metre Bands: the three classical RGB bands ((Blue (~493nm), Green (~560nm), and Red (~665nm)) and a Near Infra-Red (~833nm) band; 6 x 20 metre Bands: 4 narrow Bands in the VNIR vegetation red edge spectral domain (~704nm,~740nm, ~783nm, and ~865nm) and two wider SWIR bands (~1610nm and ~2190nm) for applications such as snow/ice/cloud detection, or vegetation moisture stress assessment.
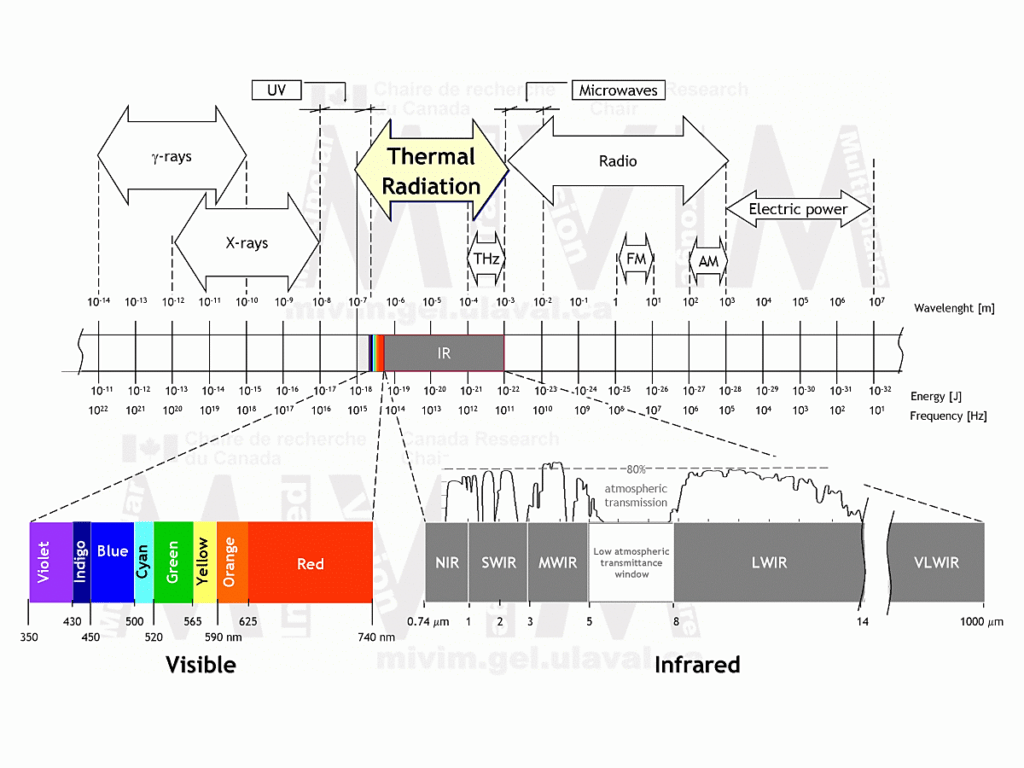
Infrared Spectrum Wavelength (source)
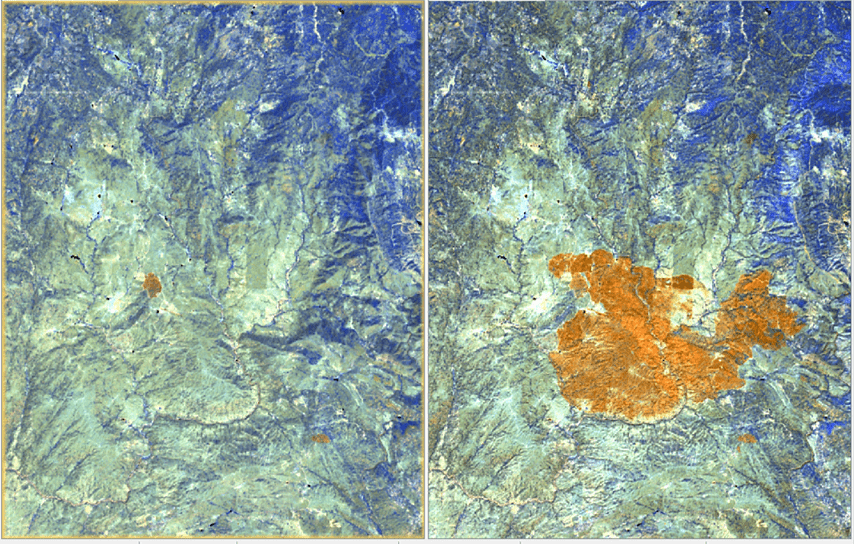
Combination RGB Bands 12-11-8A (SWIR -NIR) using images SENTINEL 2. We can see in dark yellow the polygons referring to the area pre-fire (left) and the area post-fire (right) in an event that occurred in California in 2021. Through this result, we can calculate the total of acres burned during this event. Dates of the images: July 05, 2021 (left) and August 29, 2021 (right).
Also, we applied the Normalized Burn Ratio-NBR index that considers the differences in how healthy green vegetation and burnt vegetation reflect light to find affected areas. It is calculated using the following SENTINEL 2 bands: Near Infrared/Band 8 and Shortwave Infrared/Band 12; the difference between the spectral responses of healthy vegetation and burnt areas reach their peak in the NIR and the SWIR regions of the spectrum, the following polygon (in black) refers to the calculated burn area:
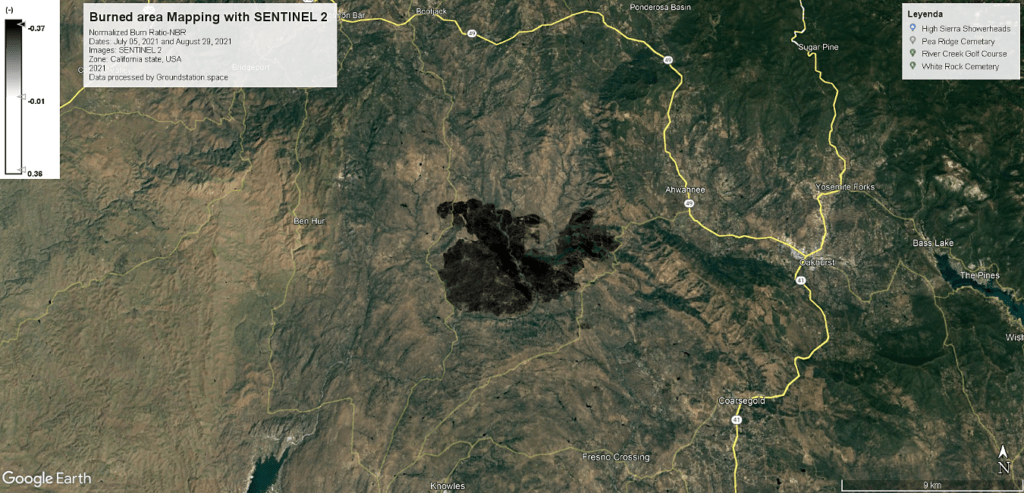
Burned Area Mapping Bands 12-8 (SWIR -NIR) using SENTINEL 2 images. We can see in black the polygon referring to the burn area (polygon overlapping in Google Earth data) from an event that occurred in California in 2021. Dates of the images July 05 and August 29, 2021
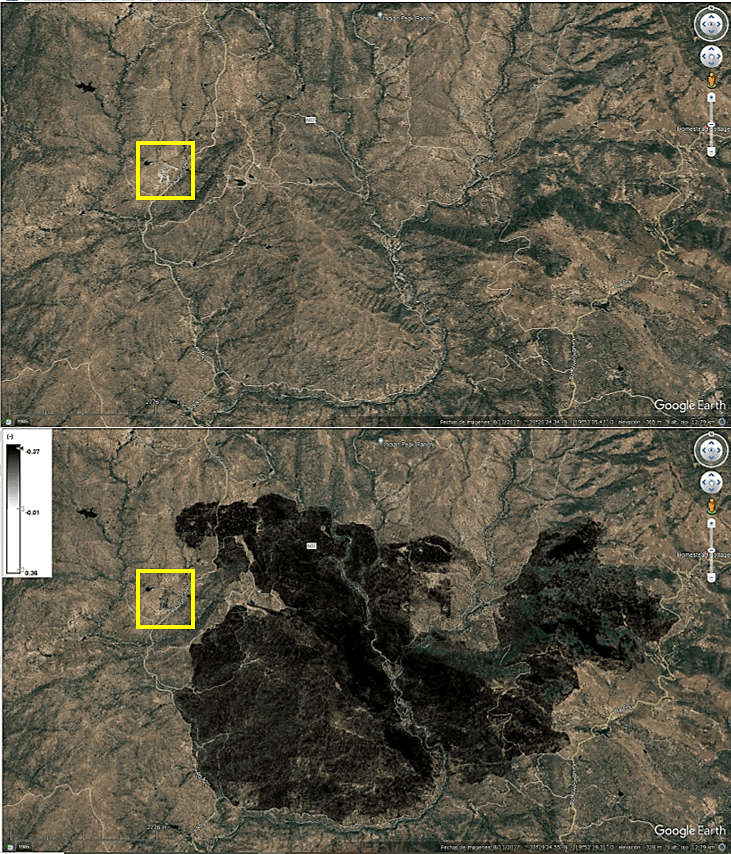
Burned Area Mapping Bands 12-8 (SWIR -NIR) using images SENTINEL 2. The polygon in black refers to the burn area (polygon overlapping in Google Earth data) from an event in California in 2021. In the yellow box, we can see the rural structure that was destroyed during this event.
launched as a response to the severity of fires that occurred in previous years. The IWPM, currently hosted by the Global Fire Monitoring Center (GFMC), is a non-financial instrument serving as a broker/facilitator between national and international agencies, programmes and projects to exchange expertise and build capacities in wildland fire management and particularly in enhancing preparedness to large wildfire emergency situations (GFMC, 2017). Working at the interface between the science community and the user community, the research and development work of the GFMC is targeted at providing capacity building and delivering problem-oriented products and solutions. The contribution of the GFMC to the UNU mandate includes applied research for developing concepts for capacity building in advanced wildland fire management.
Read more
This article is part of our series on SAR Remote Sensing Applications.


