Chronicles of Destruction: Monitoring the Kakhovka Dam Damage from Space
- Ukraine
Gabriela Quintana Sánchez
- 0
- 12 minutes read
The ongoing war in Ukraine has led to the destruction of the country and the massive displacement of its citizens. The threat to power plants in Ukraine has been observed from space, capturing every step of the military actions. On the morning of June 6, 2023, the Kakhovka Hydroelectric Power Plant on the Dnipro River in Ukraine was destroyed, and the spillway and its adjacent structures were completely damaged. Cities and several villages were flooded, causing loss of life and the destruction of urban and industrial infrastructures. In addition, there was evidence of biological and chemical contamination in the Dnipro River and the northwestern part of the Black Sea. Consequently, water supply had to be restricted in vast agricultural areas, cities, towns, villages, and the largest power plants, including the Zaporizhzhia Nuclear Power Plant.
SAR Satellite Observation of Nuclear Risks in Zaporizhzhia
Satellite Data for Monitoring Urban Settlements
The map below is one of the many examples of the application of satellite data for the monitoring and study of socio-environmental problems. According to information obtained from a SENTINEL 3 image acquired on June 6, 2023, this product shows the affected urban settlements. The affected urban settlements were Tiahynka, Lviv, Odradokamianka in the Beryslav district, Ivanivka, Mykilske, Tokarivka, Poniativka, Bilozerka, and the Ostrov district of the city of Kherson in the Kherson district.
REACH (Registration, Evaluation, Authorisation and Restriction of CHemicals- REACH), a leading humanitarian initiative that provides data, timely information and in-depth analysis of crisis, disaster and displacement contexts; initiated monitoring of the situation based on SENTINEL 3 imagery (allowing a short revisit time of less than two days for the OLCI instrument – an instrument based on the ENVISAT MERIS optomechanical and imaging design – capturing images with a spatial resolution of 300 m), identifying the flood area and affected areas.


The Kakhovka dam and hydropower plant consisted of four parts: the left bank and right bank earth dam, a concrete spillway dam with 28 spillways, a large generator room with six turbines, and a sending sluice.
The hydroelectric power plant had an output capacity of 2600 m3/s, producing 335,000 kW of power and an annual electricity production of 1.4 billion kWh [1].
In addition to electricity production, this system provided other benefits, including regional water supply. Almost simultaneously with the construction of the Kakhovka Dam, the large North Crimean Canal began to bring water from the Dnipro River to Crimean agriculture and cities.
Subsequently, the transition to more economical water use reduced the annual water intake to 1.5 km3, of which 0.5 km3 was used in the Kherson region and 1.0 km3 in Crimea. In 2014, after the annexation of Crimea, Ukraine cut off water supply to the peninsula. In connection with this, the water intake in the North Crimean Canal decreased significantly to 0.5 km3. This water was used in the Kherson region to irrigate approximately 50,000 ha, partly to grow rice [1].
Monitoring the Dam Damage
Using SENTINEL 1 images from the Copernicus Program, we performed an update in the post-event monitoring of the dam, where Change Detection polygons were generated between May-August 2023. Obtaining evidence of the dam’s destruction in the previously mentioned parts, as well as changes that occurred due to the transport of suspended sediments accumulated in the reservoir carried downstream and its flooding areas.
It is crucial to keep in mind that the changes observed between May and August could have responses in the changes that occur for various surface elements, such as changes in vegetation, changes in foliage and changes related to climate (season of the year) that are essential causes of changes. Changes observed in ground disturbances due to natural causes, such as earthquakes, tectonic activity, landslides and/or sinkholes, cause detectable changes in roads and infrastructure. Also, as in the Russia-Ukraine case, the generation of new urban developments or the destruction of structures resulting from a war.
On the day of the explosion, the Kakhovka dam was under the control of Russian forces, which occurred between 2:30 a.m. and 3:00 a.m., causing massive flows of water out of the reservoir and the washing out of essential parts of the dam. Large volumes of sediment that had accumulated in the reservoir were transported downstream.

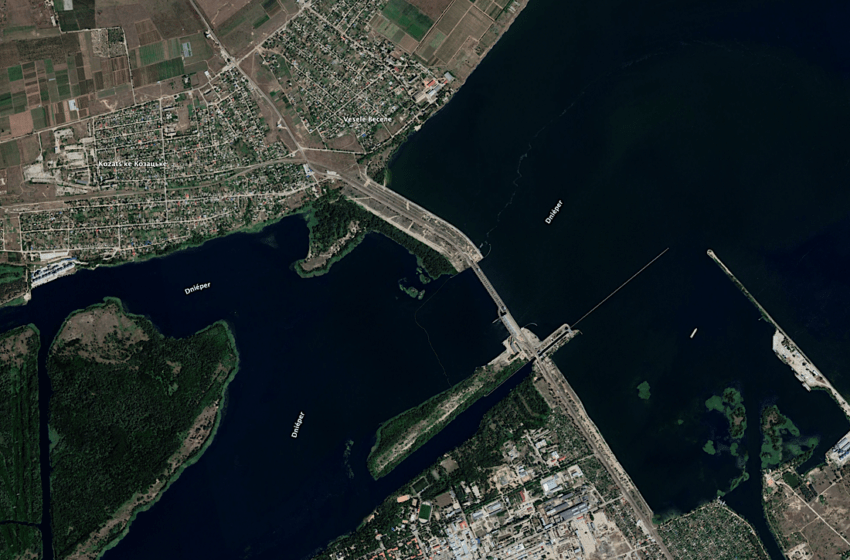
The image below shows evidence of the destruction of the dam (yellow box), applying the change detection method, using SENTINEL 1 images, the polygons in red indicate changes that occurred between May 28, 2023, and August 8, 2023, taking into account that the explosion occurred on June 6, 2023, supporting the field investigation conducted by REACH.

After the destruction of the dam, water levels downstream began to rise rapidly. At 4:00 a.m., the water level at the Kherson hydrological station before the rise was 0.31 masl. Four hours later, it reached 1.60 masl, and by 8:00 a.m. the next day, it had risen to 5.29 m. Flood flows finally reached a maximum of 5.68 m on June 8, 2023, at 3:00 a.m. Thus, the total water level rise reached 5.37 m [1].
The flooding covered extensive areas below the dam along both banks of the Dnipro River and its surroundings, as can be seen in the following image.

The image below shows the city of Kherson, where the change in the Dnipro River floodplain can be seen (yellow box).

The destruction of the hydroelectric power plant and the Kakhovka reservoir is now the largest hydroelectric facility destroyed during a war in the history of mankind, and this destruction could be evidenced through satellite data and the monitoring of the consequences generated by this anthropic action.
Space for Ukraine
Satellite data is a valuable tool that allows us to optimize time and investment costs when making on-site observations since it supports diagnosing the area of interest prior to fieldwork- not replacing it but optimizing it. At the same time, it is a support tool for decision-makers when defining the best practices for crisis intervention.

From the first days of the invasion of Russian troops into Ukraine, we have been informing you about the use of satellite data during the war.
Check out all articles on this topic on our dedicated page.
Reference:
[1] REACH (2023) Kakhovska dam damage and flood event monitoring using satellite data, 6 June 2023. Disponible en https://reliefweb.int/map/ukraine/kakhovska-dam-damage-and-flood-event-monitoring-using-satellite-data-6-june-2023