Space Technologies for Sustainable Future: From Smart Cities to Disaster Management
- Technology
Gabriela Quintana Sánchez
- 0
- 15 minutes read

Space science, technology, and geospatial data have the potential to contribute directly or indirectly to the implementation of all the Sustainable Development Goals framed in the 2030 Agenda.
Space technology, referred to as Earth Observation, communication satellites, and positioning satellites, supports decision-making for planning, management, monitoring, and control of resources, events, early warning, etc. by providing real-time information as well as temporal data from any location to promote spatial solutions in shaping a more sustainable future. Some of the applications we can take as examples include,
Technologies for Urban and Spatial Planning
The sustainable management of urban areas has become, in the last decade, one of the most important challenges of the 21st century, resulting in the concept of Smart Cities. These include different aspects, such as buildings, energy, environment, governance, living, education, and mobility. A city is defined as “smart” when its social capital, traditional and communication and information infrastructure (ICT) promote the development of a sustainable economy and a high quality of life. In previous articles, we have written about this topic, illustrating how space technology is used for its implementation. See,
Intelligent mobility
Without this, smart cities may not be sustainable. The main aspect of mobility is connectivity. Because based on connectivity, big data, open data, and information and communication infrastructure (ICT), citizens can transmit all traffic information in real-time, and in turn, public officials can simultaneously perform dynamic management, as mobility-related data can constantly change (e.g. data on available parking spaces, traffic conditions, vehicle accidents, delays in trains, subways or buses) can be reported to the public in real-time, to ensure smart, easy, and smooth travel, looking for better commuting options by knowing the current traffic status in the city.
The introduction of new transport systems and services, on the one hand, leads to an evolution in transport demand and, on the other hand, is also capable of changing user behaviour. For this reason, it is important to develop advanced tools and methods to investigate the characteristics of mobility demand. At the same time, it is necessary to make optimal use of available big data (social network profiles, apps, etc.) to better understand or shape influential lines of behaviour in the use of transport networks. Satellite data from communications and positioning satellites contribute to the development of efficient mobility in smart cities. See,
Renewable energy forecasting
Satellite data help assess renewable resources, enabling more efficient development and use of clean energy technologies. A pressing global challenge is the need for sustainable energy sources. Climate change has underlined the importance of the transition from fossil fuels to renewable energy. Space technologies play a key role in this transition by enabling the identification of areas suitable for renewable energy generation, such as solar and wind power. See,
Disaster Monitoring
“Nothing undermines sustainable development more than disasters. They can destroy decades of progress in an instant. Understanding and managing disaster risk is essential to achieving Sustainable Development”. Antonio Guterres, United Nations Secretary-General (UNITED NATIONS OFFICE FOR DISASTER RISK AND REDUCTION, 2022).
When a city or region is affected by an emergency or disaster, the first efforts focus on caring for the injured and restoring basic services. This is followed by efforts to restore and rebuild communities. Such efforts can be structured in three phases:
- The response phase, which involves activities such as search and rescue of the injured and affected, rapid assessment of damage and needs, and provision of first aid, followed by the opening and management of temporary shelters for those made homeless and the provision of humanitarian assistance to those affected.
- The rehabilitation phase, in which basic services are restored, even temporarily, includes the road network and other essential facilities, including bridges, airports, ports, and helicopter landing strips.
- The recovery phase, in which reconstruction efforts are carried out, is based on a more detailed assessment of the damage and the degree of destruction of infrastructure.
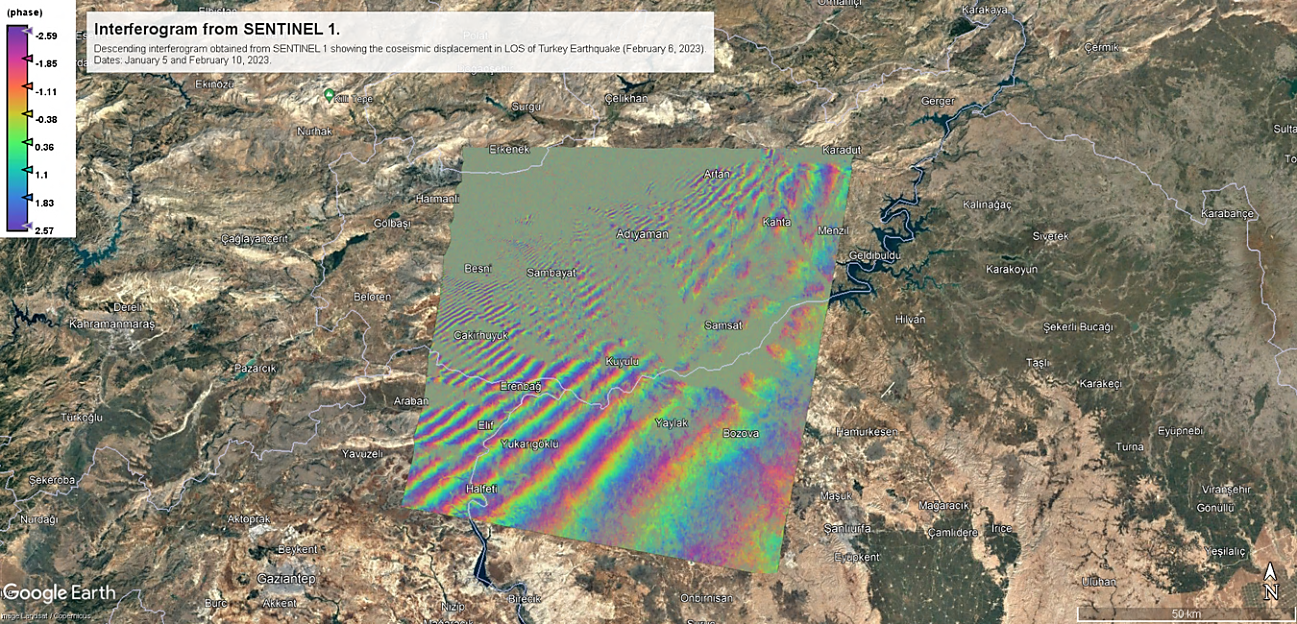
The information obtained through spatial technology, associated with population data and infrastructure data, can support the processes and/or different phases of the response, rehabilitation, and recovery process during and after a disaster. Below are some examples of thematic maps obtained from satellite data and processing algorithms. For more algorithms, an application dotSPACE recently released Open Atlas (see more)


Early warning
Refers to the provision of information about an emerging hazardous circumstance where such information can enable advance action to be taken to reduce the risks involved. It can be structured in the following phases:
- Risk awareness: Provides essential information for setting priorities for mitigation and prevention strategies and the design of early warning systems.
- Monitoring and forecasting: Provide timely estimates of the potential risk faced by communities, economies, and the environment.
- Information dissemination: Sending warning messages (reliable, synthetic, and simple to be understood by authorities and the public) to potentially affected locations to alert local and regional government agencies.
- Response: Coordination, good governance, appropriate action plans, public awareness, and education are key to effective early warning.
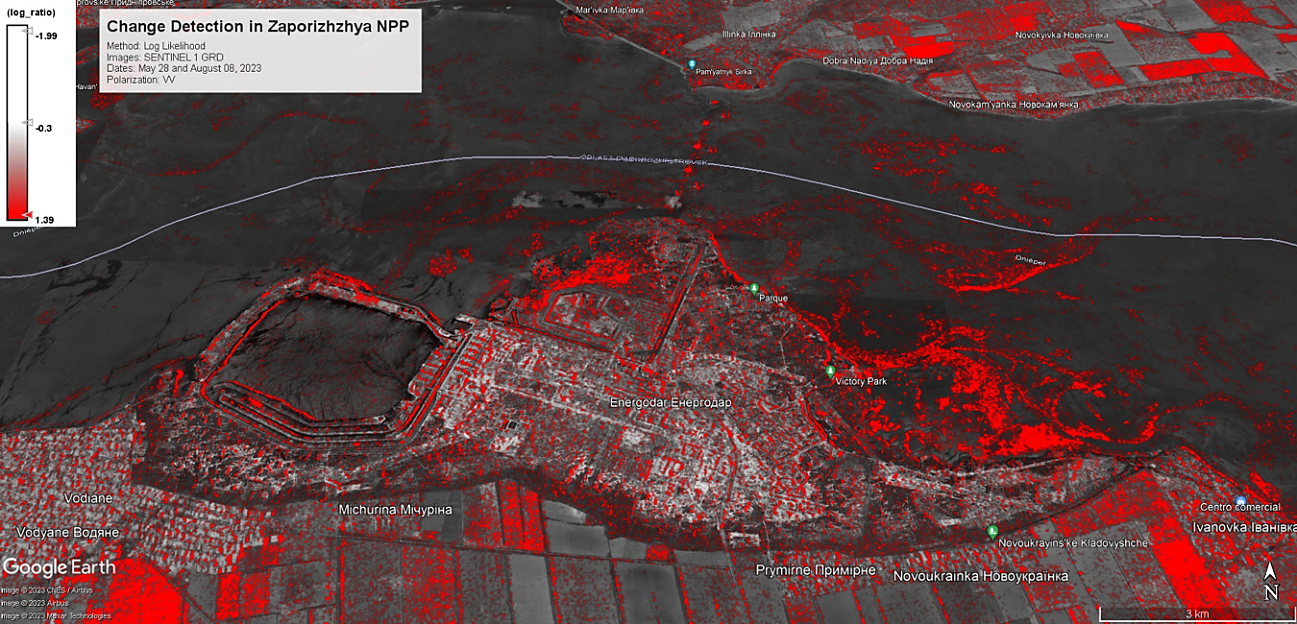
The following is an example of the dissemination of information warning of possible damage to the Zaporizhzhya Nuclear Power Plant in Ukraine as a result of the war between Russia and Ukraine.
Measuring and anticipating the effects of future natural hazards is important for implementing measures to mitigate the effects of disasters. In all phases of crisis management, satellite-derived information plays an essential role as a synoptic, independent, and objective source. Satellite data provides information products and analysis for more effective disaster risk reduction and conflict prevention, as well as in the assessment of post-disaster response needs, recovery, and reconstruction planning.
(*) The recorded changes by the change detection algorithms can have different sources, from natural causes to conflict zone damages or agricultural activities, sometimes all in one image. Possible interpretations or causes may include the following: a. Changes in vegetation status due to foliage changes, agricultural crop cycles or rotation, or weather-related vegetation changes are in general, the usual cause for detected changes. It is easily identifiable and visible in the presented imagery where the agricultural fields or forests suffer seasonal changes. Weather situation, whereas often, radar signals are influenced by changes in water heights within rivers, lakes or ponds, or by snowfalls blanketing the ground and, in general, other changes in weather that influence the texture of the soil or vegetation. c. Ground disturbances or displacements due to natural causes, such as earthquakes, volcanic or tectonic activity, landslides or sinkholes, which cause large enough movement of the ground surface, roads and infrastructure and are detectable by the change detection algorithms d. Urban development such as removing old buildings, building new ones, or, in general, structural changes of the buildings or features within the urban environment.
Our goal was to identify and make visible these changes and provide them to the (non-) expert community as direct or supporting material for the interpretation of the sources that triggered these changes. The applied algorithm helps to build imagery that can be interpreted as is, but for a thorough interpretation of the sources, causes, and evolution, additional background or ground truth information is necessary or correlated with other measurements that capture ground displacements or structural/textural changes.
Do you want to know more about it? Watch the recording of our webinar ‘Leveraging Space Technology for Sustainable Infrastructure Development’.
Featured image credit: Freepik


