Change Detection in Cities Using SAR Images
- Disaster Management Technology Urban
Gabriela Quintana Sánchez
- 1
- 10 minutes read
The rise in population in the last 100 years has led to a rapid expansion of the world’s cities. As a consequence, there are big infrastructure developments and construction projects, leading to urban change, which requires monitoring. Similarly, natural disasters or war can cause quick changes to a city infrastructure. Remote sensing by imaging radar satellites (SAR) offers an efficient method to monitor both these natural and unnatural changes in cities.
Weather independent monitoring
SAR applications require intense and specialised data analysis, to detect spatial and temporal changes. We wrote about this in a previous article. It is an incredible technical challenge to detect changes over time in cities under a variety of conditions. Many cities in tropical regions suffer from extensive cloud cover or prolonged periods of heavy rainfall and tropical storms. Under these conditions, weather-independent radar is the only system that can provide continuous imagery.
Detecting small changes with radar
A SAR image is a matrix that contains physical information about targets on the Earth’s surface. This surface undergoes change over time, for example when structures are built, or removed. This removing and building up of structures may happen slowly over time, as cities expand, but can also happen very suddenly, in emergencies like earthquakes. SAR is a very good method to evaluate a city’s infrastructure after an earthquake.
Radar data is nowadays precise enough to monitor changes in individual buildings. One of the first large-scale applications of this happened in the earthquake in L’Aquila (Italy) in 2009. SAR data was used here to provide a quick assessment of damage incurred during this devastating earthquake. See a longer article about this particular case in the article “Detecting earthquake damage in urban area: application to COSMO-SkyMed imagery of L’Aquila earthquake” in the SPIE Digital Library.
Very High Resolution SAR
Nowadays, there are several methods to compare the pre seismic and the post-seismic situation, using coherence, correlation or backscattering.
Change detection in urban areas uses Very High Resolution (VHR) SAR data. Much of this research was presented at the ESA International Workshop on Advances in the Science and Applications of SAR Interferometry and Sentinel-1 InSAR. Some of the imagery presented in this workshop can be found here.
Interferometric Synthetic Aperture Radar – or InSAR – is a remote sensing technique where two or more images over the same area are combined to detect slight changes occurring between acquisitions. Tiny changes on the ground cause changes in the radar signal and lead to rainbow-coloured interference patterns in the combined image, known as an ‘interferogram’. (source: ESA)
Interpreting changes in SAR images – A technical story
In a VHR SAR image an individual building is characterised by a very distinctive pattern: A bright area corresponding to the reflection (also known as ‘backscatter’) from building walls and roof, a very bright stripe due to the double reflection from the ground to the wall facing the radar transmitter, located in the foremost side of the building, and a dark area corresponding to the building shadow, extended to the far side of the building.
When a building collapses, the double bounce and the layover areas drastically decrease in brightness. At the same time, an increase of backscattering can be observed due to the scattering from debris laying within the building footprint and to the return coming from the ground previously occluded by the building shadow (see Figure 1 and 2).
Detecting Earthquake Damage
In below image you can see how destroyed buildings usually appear in a multi-temporal SAR image (right). This image was generated by assigning the red channel to the pre-event image and the green and blue channels to the post-event image. In such an image, the red colour indicates the decrease of the backscatter in the post-seismic image due to the building collapse, while cyan pixels single out the increase in the backscattering values due to the presence of debris and to the vanishing of the building SAR shadow.
Image a) on the left shows an optical post-event overview (from the GeoEye satellite), while image b) is an RGB composite of pre-event (Red) and post-event (Green and Blue), taken by the COSMO-SkyMed constellation (using the ‘Spotlight’ VHF beam). Green polygons indicate severely damaged buildings, with presence of a lot of debris and complete vanishing of the building’s SAR shadow.

This method is now commonly used with SAR images from most platforms, like Envisat, Sentinel-1, PalSar, etc.
Detecting city development
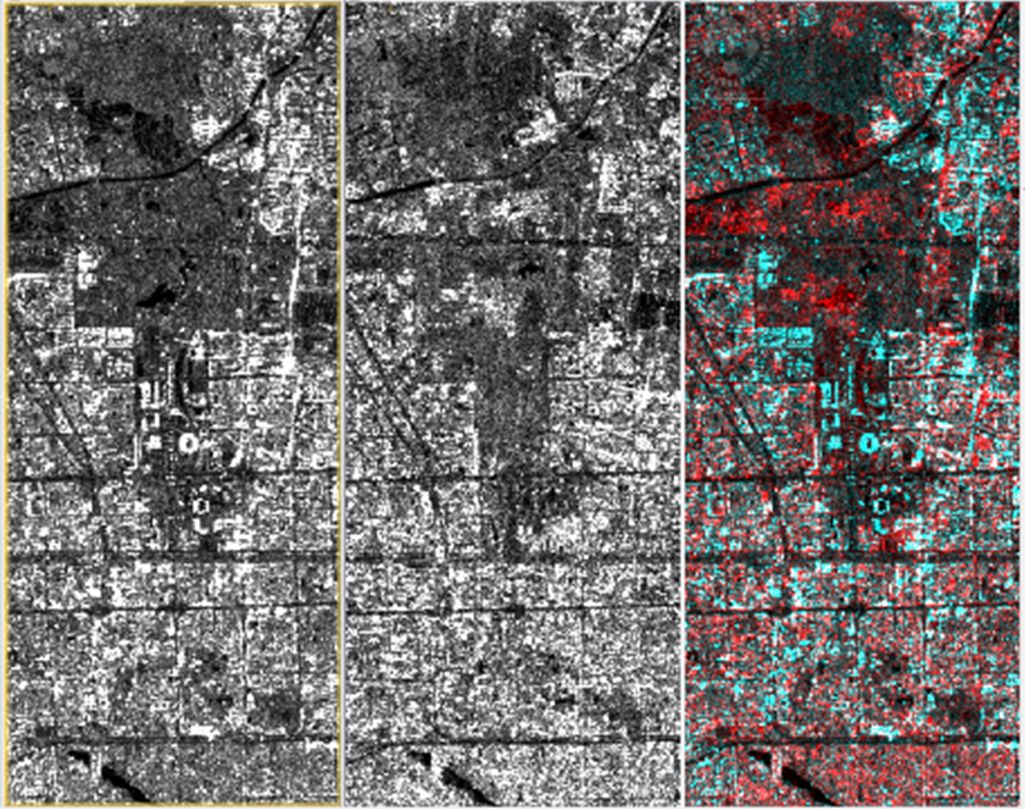
The second example image below shows the expansion of the city of Beijing from 2003 to 2015. In the middle you see an Envisat image of the situation in 2003, while the left image is a Sentinel-1A capture from 2015. The right-hand image is the resulting change detection composition in RGB, showing new structures by assigning the red channel to the 2003 image and the green and blue channels to the situation in 2015.
In this composite image, a cyan colour indicates the increase of the backscattering in the 2015 image, due to the new structures. Red pixels single out the decrease in the backscattering, due to removal of structures between 2003 and 2015. In one image you can see both addition (cyan) and removal (red) of buildings in a city. In this example you can see the new Olympic Stadiums and Olympic Village (built for the 2008 Beijing Olympic Games) in cyan.
Change detection in cities: by nature and by humans
The change detection method can be used to detect destroyed buildings due to natural disasters, like earthquakes, hurricanes or tsunamis. When combining this data with population data, this gives us the possibility to very quickly assess material and human damage in a city, and also shows the reconstruction process in disaster areas.
In this article we looked at the impact of natural disasters, but in 2022 this exact same method is used to detect damage done by war in places like Syria and Ukraine. We published several articles about detecting war damage from space in our series about satellite data in support of the people of Ukraine.
Similarly, but over much longer periods of time, we can detect new construction and removal of old construction, reflecting the less catastrophic and more human evolution of modern cities.
Featured image: Freepik/Yaroslav Danylchenko